Average order value gets treated as a growth metric. Raise it and you make more money per customer, which is true and slightly boring. That is not why we are writing about it.
We fund Google Shopping ads for stores and bill a commission on the orders those ads produce. That means we pay for every click before anyone knows whether it converts. Whether we can do that for a given store is not a judgment call. It is a sum with three inputs, and average order value is one of them.
It is also the only one of the three that belongs entirely to the merchant. That is the whole argument of this post, and everything below it is either the arithmetic that proves it or the practical work that follows from it.
The Sum That Decides It
We publish this sum in full on the gradient intent model page, and it is short enough to hold in your head:
CPC ceiling = (order value x commission rate x conversion rate) / ROAS target
Read left to right. An order is worth some amount. We earn a percentage of it. Only a fraction of clicks become orders. Divide by the return we need to make the funding work, and you get the most anyone can pay for a click to your store and still come out ahead.
The worked example on that page uses a $200 order at a 12% commission rate. That is $24 to us. At a 3% conversion rate, the average click is worth 3% of $24, which is $0.72. Divide by a 1.1 target and the bid ceiling is $0.65.
Sixty five cents. That is the number the entire campaign lives inside. If clicks in your category cost more than that, no amount of feed work or bid strategy fixes it, because the ceiling is not a preference. It is what the arithmetic permits.
Notice the shape of the sum. The first three terms are multiplied together. Nothing is added, nothing is subtracted, and no term is squared. That has a consequence most people miss.
Three Terms, and Only One Is Yours
Because the three terms multiply, a 20% improvement in any one of them produces exactly the same result. Raise the $200 order to $240 and the ceiling goes to $0.78. Raise the 12% commission rate to 14.4% and the ceiling goes to $0.78. Raise the 3% conversion rate to 3.6% and the ceiling goes to $0.78.
Same number, three times. That is not a rhetorical trick, it falls straight out of multiplication. Which means the interesting question is not which lever is strongest. They are all exactly as strong as each other. The interesting question is which lever you can actually pull.
Commission rate comes off your margin. Every point we add to the rate is a point you no longer keep. You can negotiate it, and the rate should reflect the real economics of the store, but it is a transfer, not a gain. Nobody creates value by moving the rate. It just decides who holds the value that already exists.
Conversion rate is slow and only partly yours. You control page speed, product photography, review coverage, shipping clarity, checkout friction, and trust signals. You do not control whether the shopper is on a train with one bar of signal, whether they have already bought this from someone else, or whether they came to browse. Real conversion rate work takes months and a lot of it lands in single digit percentage improvements on a number that is itself a small percentage.
Average order value is different. You set the prices. You decide the shipping threshold. You decide what appears next to the add to cart button, whether a three pack exists, and whether anything is offered after checkout. Nobody has to agree with you. There is no auction, no algorithm, and no negotiation. You can change it this afternoon and see the effect within a fortnight.
That is why this post is about average order value and not about the other two. Not because it matters more. Because it is the one you own.
What Too Low Actually Looks Like
Abstract arithmetic is easy to nod along to, so here is a real shape of store. Average order value of $28. A site wide conversion rate of 2.5%, which is a perfectly respectable number and better than a lot of stores manage.
First correction: Shopping traffic is colder than your site average. Your site wide figure includes people arriving from your email list, people typing your name into Google, direct traffic, and returning customers who already trust you. A Shopping click is a stranger comparing your product against a grid of alternatives. We apply a haircut of about 0.6 to site wide conversion rate before we judge anything, so 2.5% becomes roughly 1.5% on paid Shopping traffic.
At 1.5%, one order in every 67 clicks. So the question becomes simple: what do 67 clicks cost, and is the order worth more than that?
Across our portfolio, the average Shopping click cost about $0.23 over the 90 days to September 2026, measured across 92 stores. Sixty seven clicks at $0.23 is about $15.30 of ad spend to produce one $28 order.
The commission rate that just covers that spend is $15.30 divided by $28, which is about 55%. Add the modest return we need on funded spend and it is about 60%. The rates we publish for real merchants sit between 12% and 20%. There is no version of this deal that works, and it is not close enough to argue about.
Turn the conversion rate down slightly and it gets worse in a way that is worth seeing. At a 1% site wide rate, which is 0.6% on paid traffic, an order takes about 167 clicks. That is roughly $38 of clicks to earn a $28 order. The break even commission rate is now above 100%. There is no rate at all, not 35%, not 90%, because the clicks cost more than the order is worth before anyone takes a cut.
Here is the part that usually gets skipped. None of that says anything about whether this is a good business. A $28 average order can be an excellent business. It can have wonderful margins, delighted repeat customers, strong word of mouth, and a founder who sleeps well. What the sum says is narrower and much less interesting than it sounds: paid Google Shopping, funded by a third party who eats the click cost, is not the right channel for it today. That is a statement about one acquisition channel, not a verdict on the store.
So what would it take? At that $28 order value and 1.5% paid conversion rate, the ceiling works out at about 4.6 cents a click against a click that costs 23 cents. The store is about 5 times short.
Five times sounds hopeless until you remember the terms multiply. Nobody has to find a 5x lever. Move average order value from $28 to $75, lift paid conversion rate from 1.5% to 2%, and settle at a commission rate of 20% rather than 12%, and you have 2.7 times 1.33 times 1.67, which is just under 6x. That clears it. Three ordinary moves, not one heroic one, and the largest of the three is the one you control.
Run Your Own Numbers
Rather than have you reverse engineer your own version of the above, we built the sum into a page. The feasibility calculator takes your average order value, your site wide conversion rate, and a commission rate, applies the same haircut and the same target we use internally, and tells you how far off the bar you are and by how much.
One thing to note about it: it does not ask you for a cost per click. That is deliberate. Most merchants do not know theirs, and the ones who do know it from their own Google Ads account, which is a different bidding position under a different strategy and is not the number that would apply here. Asking you for it would make the tool confidently wrong rather than merely harder to fill in. We supply our own measured figure, we show you what it is, and we tell you when it was measured, so you can disagree with it on the record instead of guessing at what we assumed.
If the tool tells you the channel does not clear the bar today, the rest of this post is what to do about the term you control.
Four Levers, in Order of How Fast They Move
These are ordered by time to effect, not by size of effect. If you are trying to change the shape of your numbers before a decision gets made about your store, start at the top and work down.
1. Cart thresholds, which move within days
A free shipping threshold set above your current average order value, with a visible progress indicator in the cart, is the fastest lever in ecommerce. It needs no new products, no new photography, and no merchandising decisions. It is a shipping rate in your Shopify settings and a progress bar in your cart.
The usual guidance is to set the threshold somewhere between 15% and 30% above your current average order. Too close and it changes nothing, because most baskets already clear it. Too far and shoppers read it as unreachable and ignore it. If your average order is $55, a $70 threshold makes people add one more thing. A $150 threshold makes them close the tab.
The catch is that free shipping is not free. You are paying for it out of margin, which means this lever quietly turns into the first of the three failure modes below if you do not check the arithmetic first.
2. Cross sell at the point of intent, which moves within a week or two
Cross sell works when it appears where the shopper has already decided, which means the product page below the add to cart button, and the cart itself. It does not work on the homepage, where nobody has decided anything yet, and it works poorly as a popup that interrupts a decision already in progress.
The offer has to be a genuine complement, not a second version of the thing they are already buying. Someone buying a coffee grinder will consider beans, a scale, or a storage tin. They will not consider a second grinder. The most reliable source of good pairings is your own order history rather than an algorithm's opinion, at least until you have enough volume for the algorithm to have an opinion worth having.
Keep it to one or two suggestions. Cross sell widgets showing eight products convert like a category page, which is to say they do not.
3. Bundles and quantity breaks, which move within a month
This is slower because it involves real merchandising work, and often new SKUs, but it produces the largest durable lift of the four. A bundle raises the order value of the very first purchase rather than hoping for an add on, and a quantity break turns a consumable into a stock up purchase.
Quantity breaks are the underrated half of this. If you sell anything people use up, a three pack at a modest discount often outperforms an elaborate mixed bundle, because it asks the shopper to make no new decisions at all. They already want the thing. You are only asking how much of it.
Bundles are also the lever most likely to break something else, which is covered below. New SKUs land in your Google Shopping feed, and a bundle SKU does not behave like a normal product there.
4. Post purchase offers, which move slowest of all in the sum
A post purchase upsell shown after checkout is genuinely good money. It converts well, it costs nothing to show, and the shopper has already given you their card details.
It is last on this list for a specific reason. In most setups the conversion value reported back to Google is captured when the order completes, before the post purchase offer is accepted. So a post purchase upsell can lift your real average order value without lifting the average order value that appears in the paid channel's reporting, and it is the reported figure that the sum at the top of this post is fed with. Genuinely worth doing. Slowest of the four to change the decision this post is about.
The Apps
Eight apps, with what each is actually for. Ratings and prices below were read off the public Shopify App Store listings on September 1, 2026, and they move, so check before you install. Read the disclosure in the next section before you read this one.
Shopify Bundles, by Shopify
Free, first party, and rated 2.8 stars from 543 reviews, which is the worst rating on this page. Start here anyway. Shopify Bundles builds fixed bundles and multipacks directly in the admin with real inventory syncing, it costs nothing, and it is the only way to find out whether bundling moves anything for your catalog before you commit to a monthly bill. The low rating is mostly merchants hitting the edges of what it does not do, which is customization and mix and match. If you hit those edges, that is useful information and the paid options below become worth paying for. If you do not, you just solved the problem for free.
UpCart Cart Drawer, by Rokt
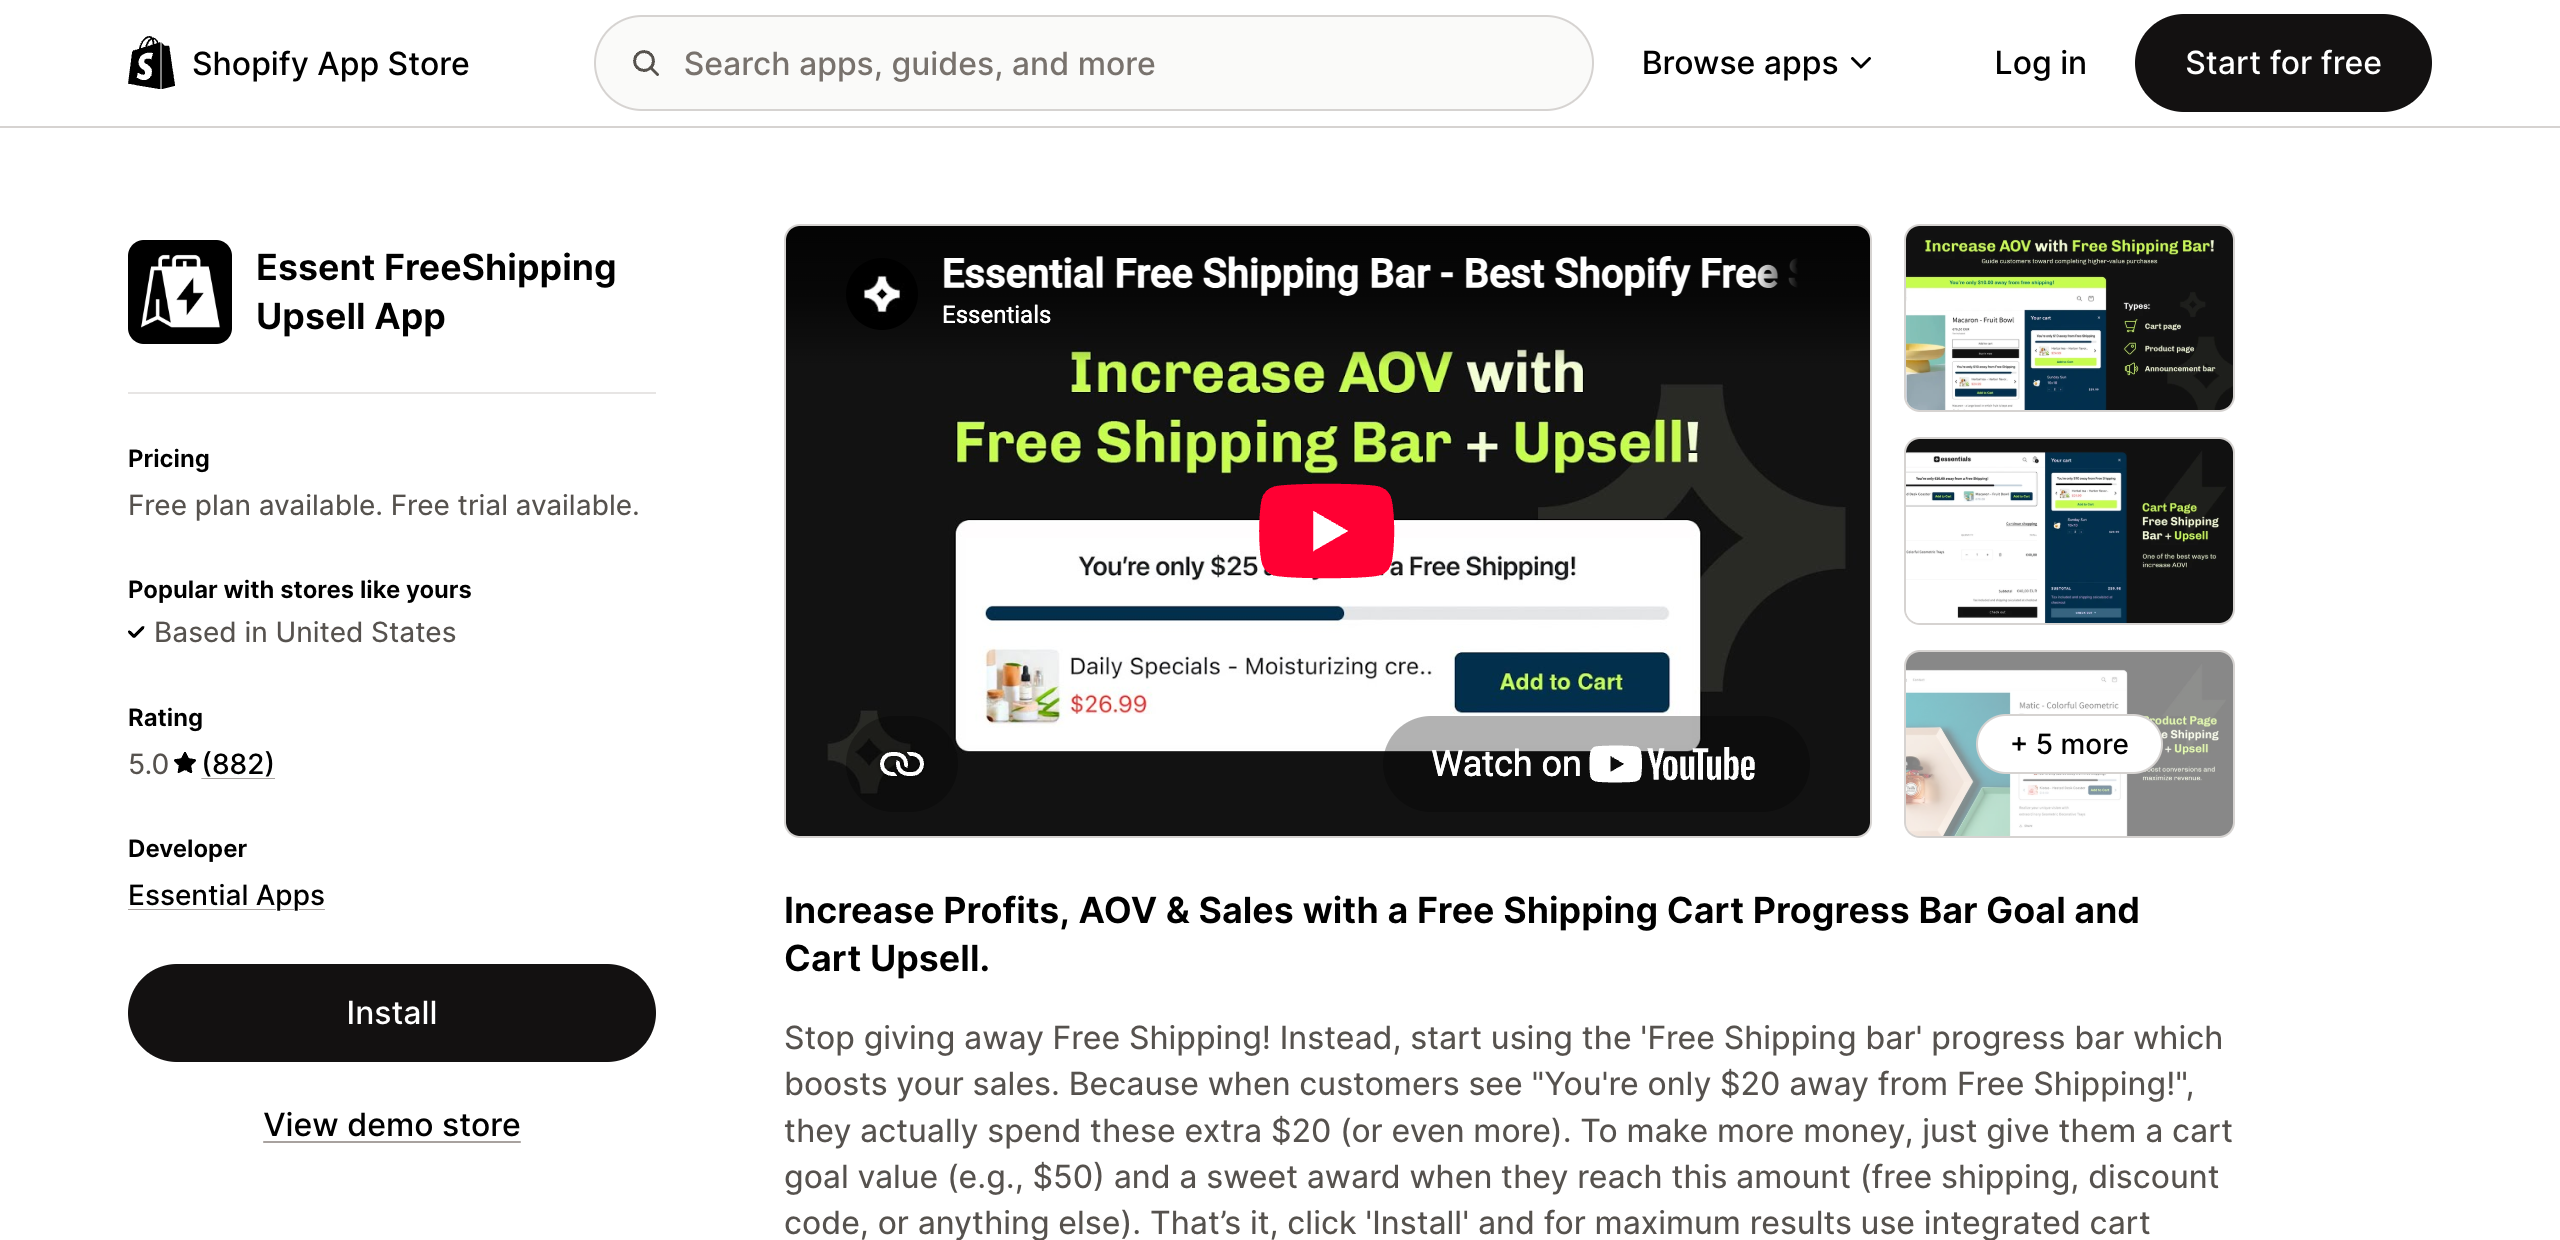
Rated 4.7 stars from 871 reviews, with plans starting around $29.99 a month and a 14 day trial. UpCart is a cart drawer with a free shipping progress bar, in cart upsells, and add ons like shipping protection. It exists to make lever one and lever two happen in the same place, which is the cart, and it is the most direct route to a working shipping threshold with a visible progress indicator.
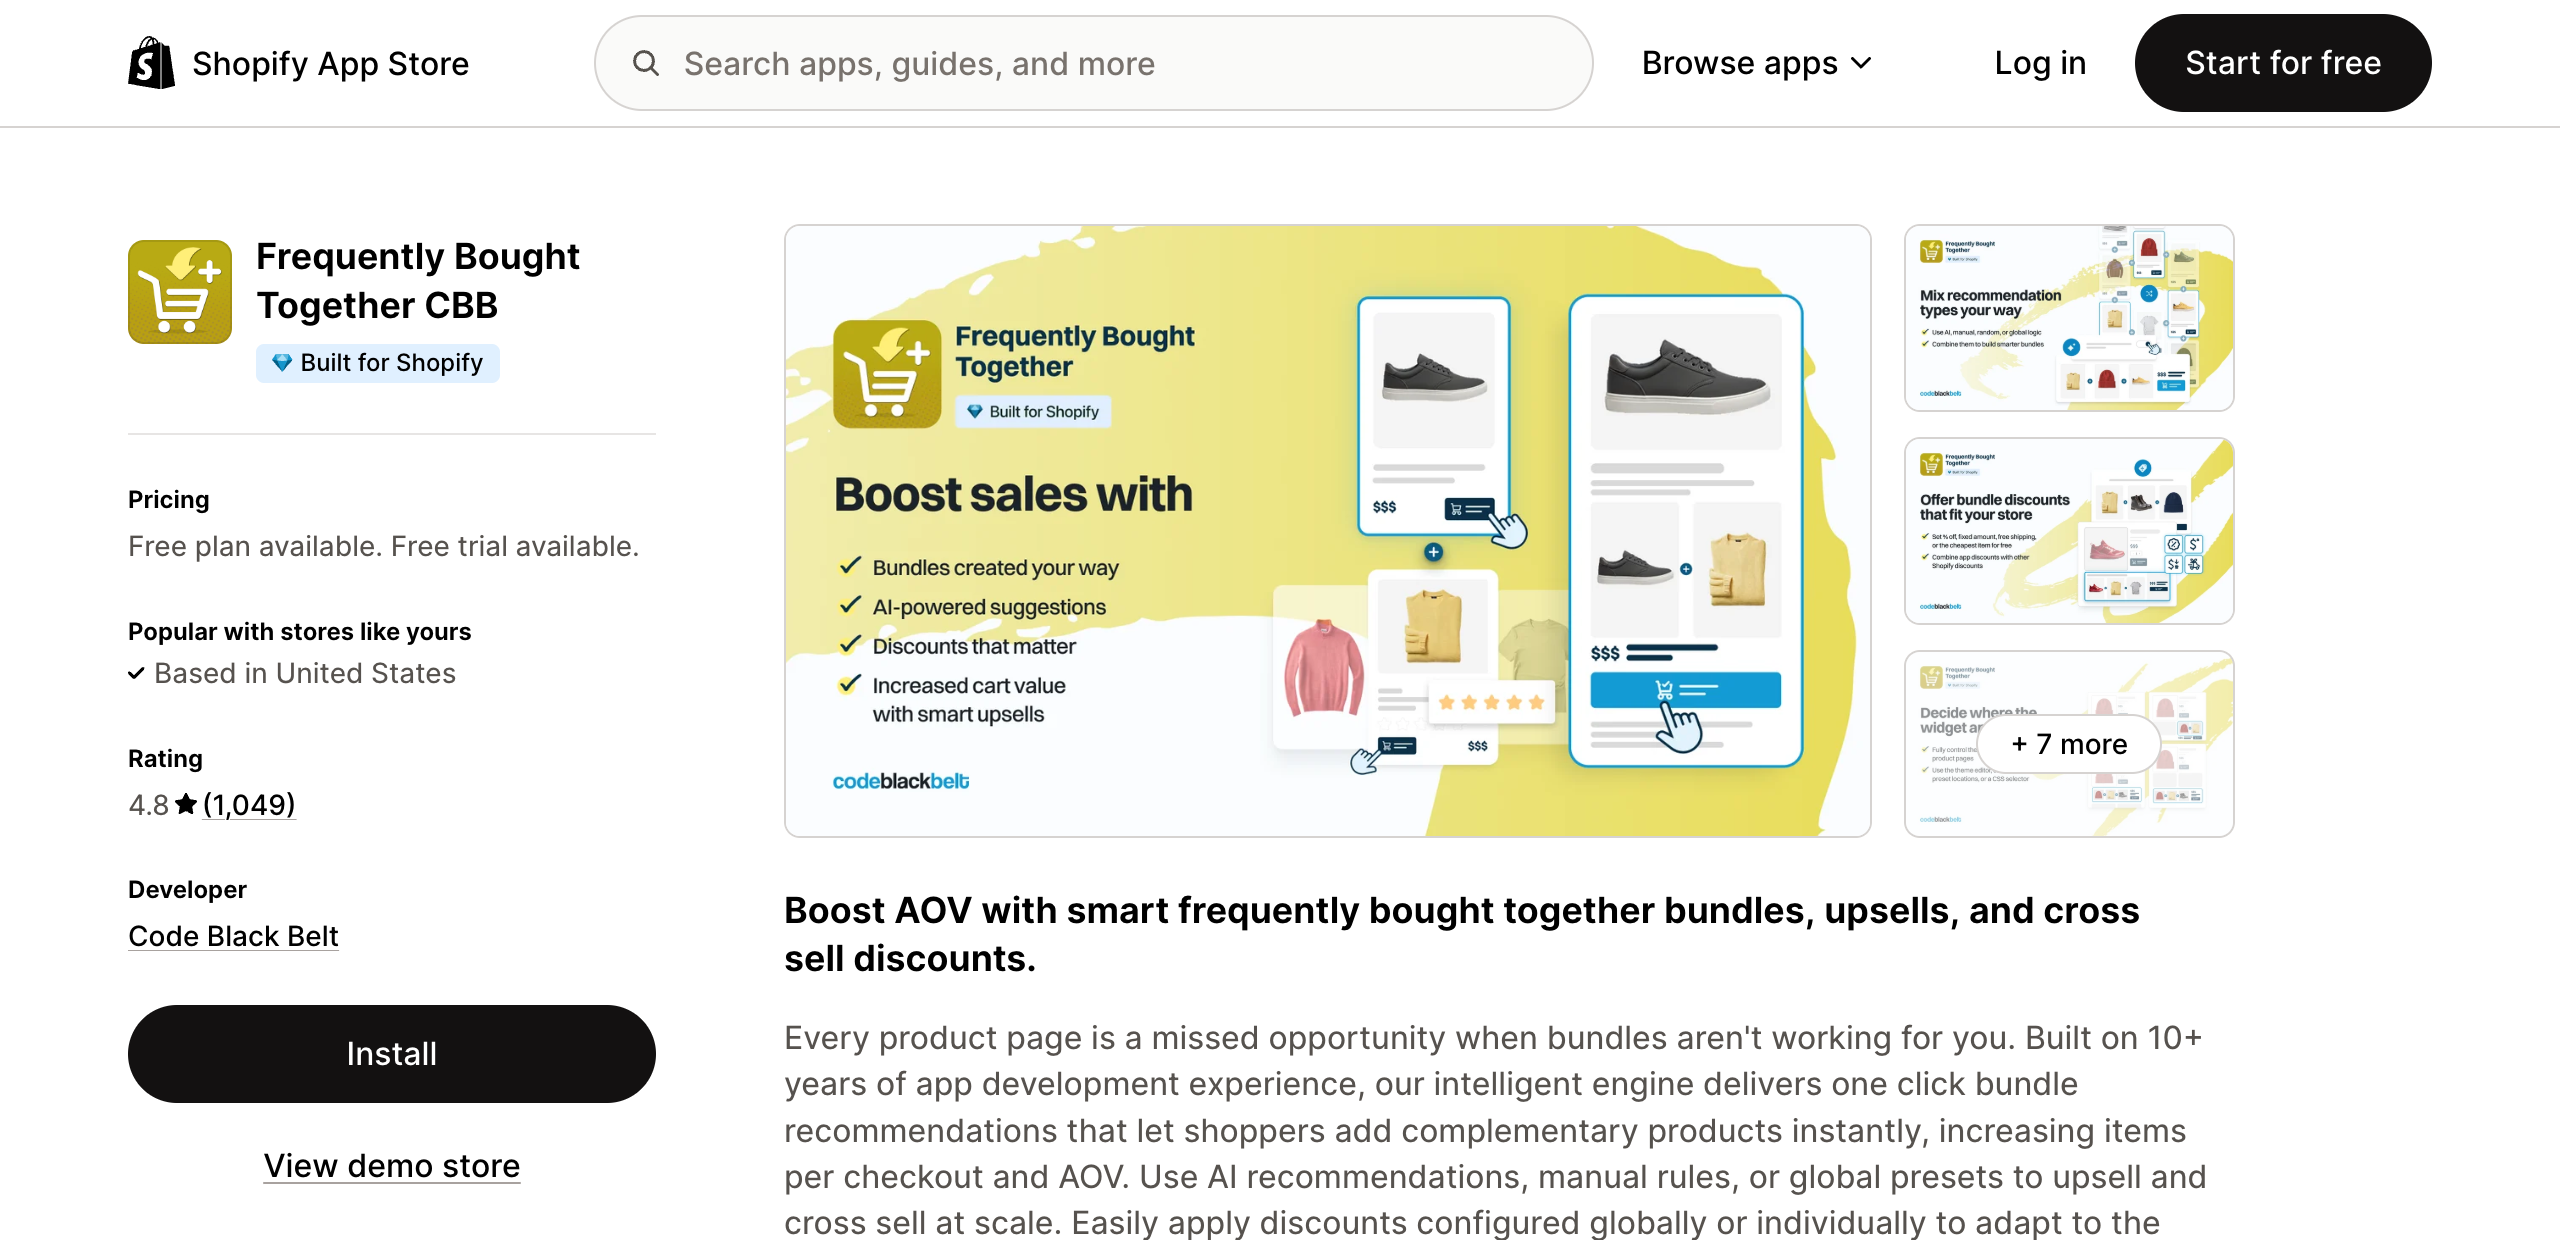
Frequently Bought Together, by Code Black Belt
Rated 4.8 stars from 1,046 reviews, with a free starter plan and paid plans from around $14.99 a month. Frequently Bought Together does one job, the Amazon style bundle widget on the product page, with recommendations you can either train or set by hand. If you want lever two and nothing else, this is the narrowest tool for it, and the free tier means you can prove the concept before paying.
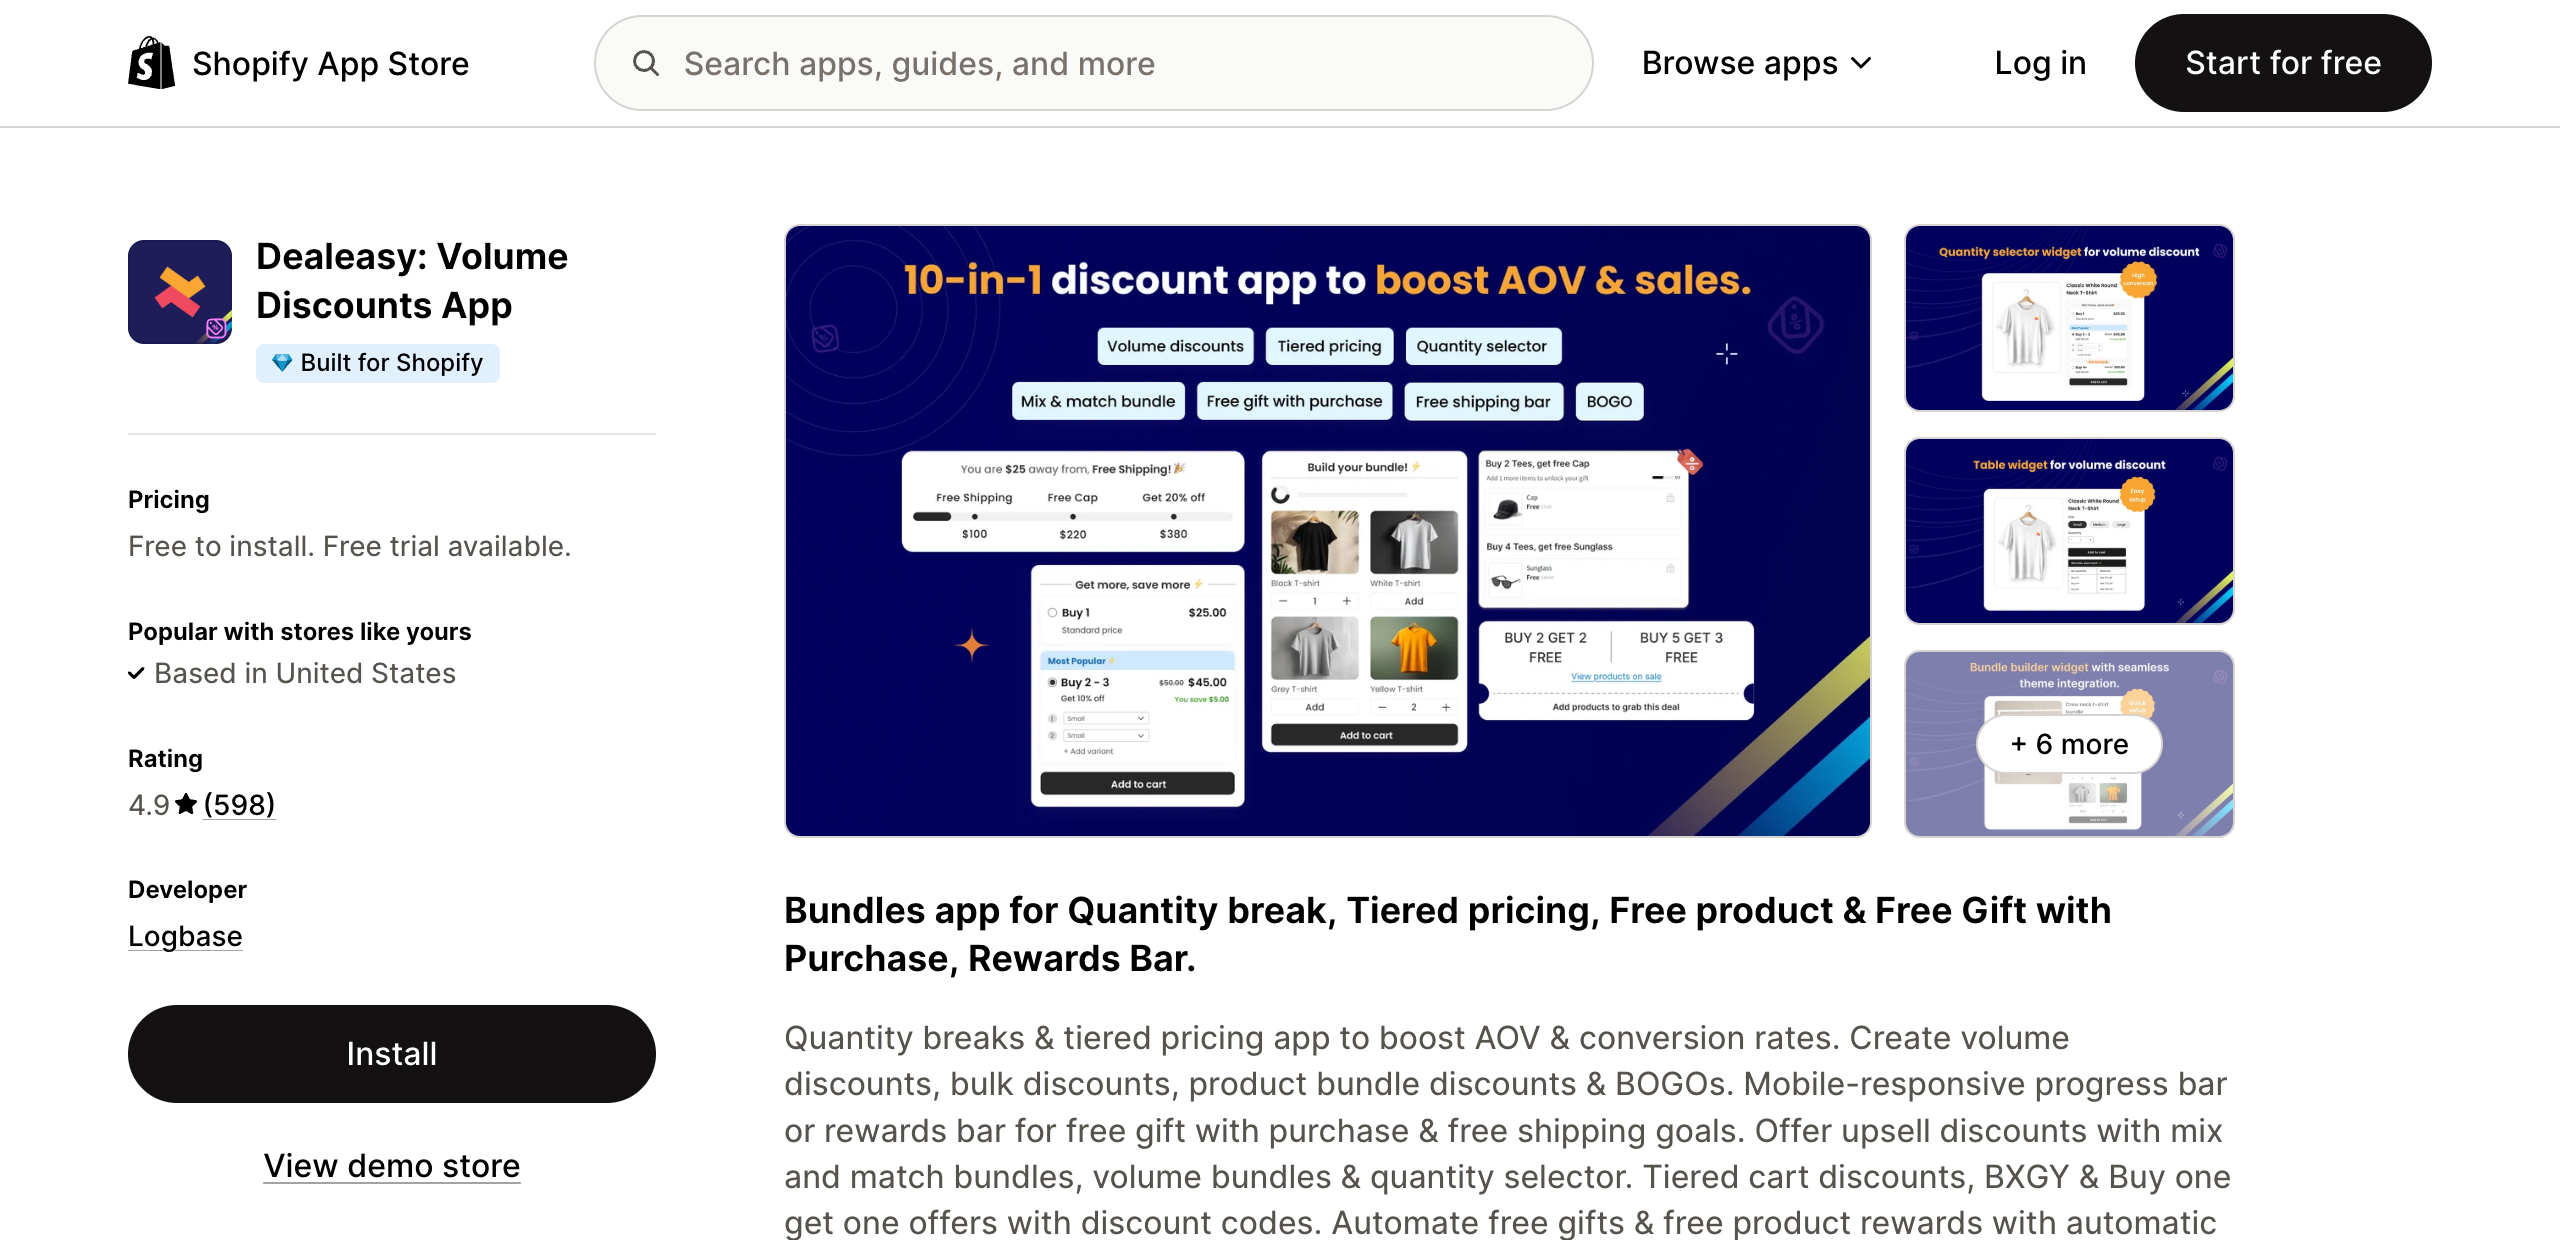
Selleasy, by Logbase
Rated 4.9 stars from 2,539 reviews, free up to 50 orders a month and around $9 a month after that, which makes it the cheapest paid option here. Selleasy covers product page upsells, cart cross sells, and post purchase offers in one app rather than three. For a small store that wants to test several of the levers at once without stacking subscriptions, this is the pragmatic pick.
Rebuy Personalization Engine
Rated 4.7 stars from 748 reviews, with paid plans from around $25 a month scaling with order volume. Rebuy is the heavyweight option: rules driven and data driven recommendations across the product page, cart, checkout, and post purchase, with A/B testing built in. It is genuinely more capable than the rest of this list and it is genuinely more work. It earns its price at volume, where a one point difference in attach rate is real money, and it is overkill for a store still deciding whether cross sell works at all.
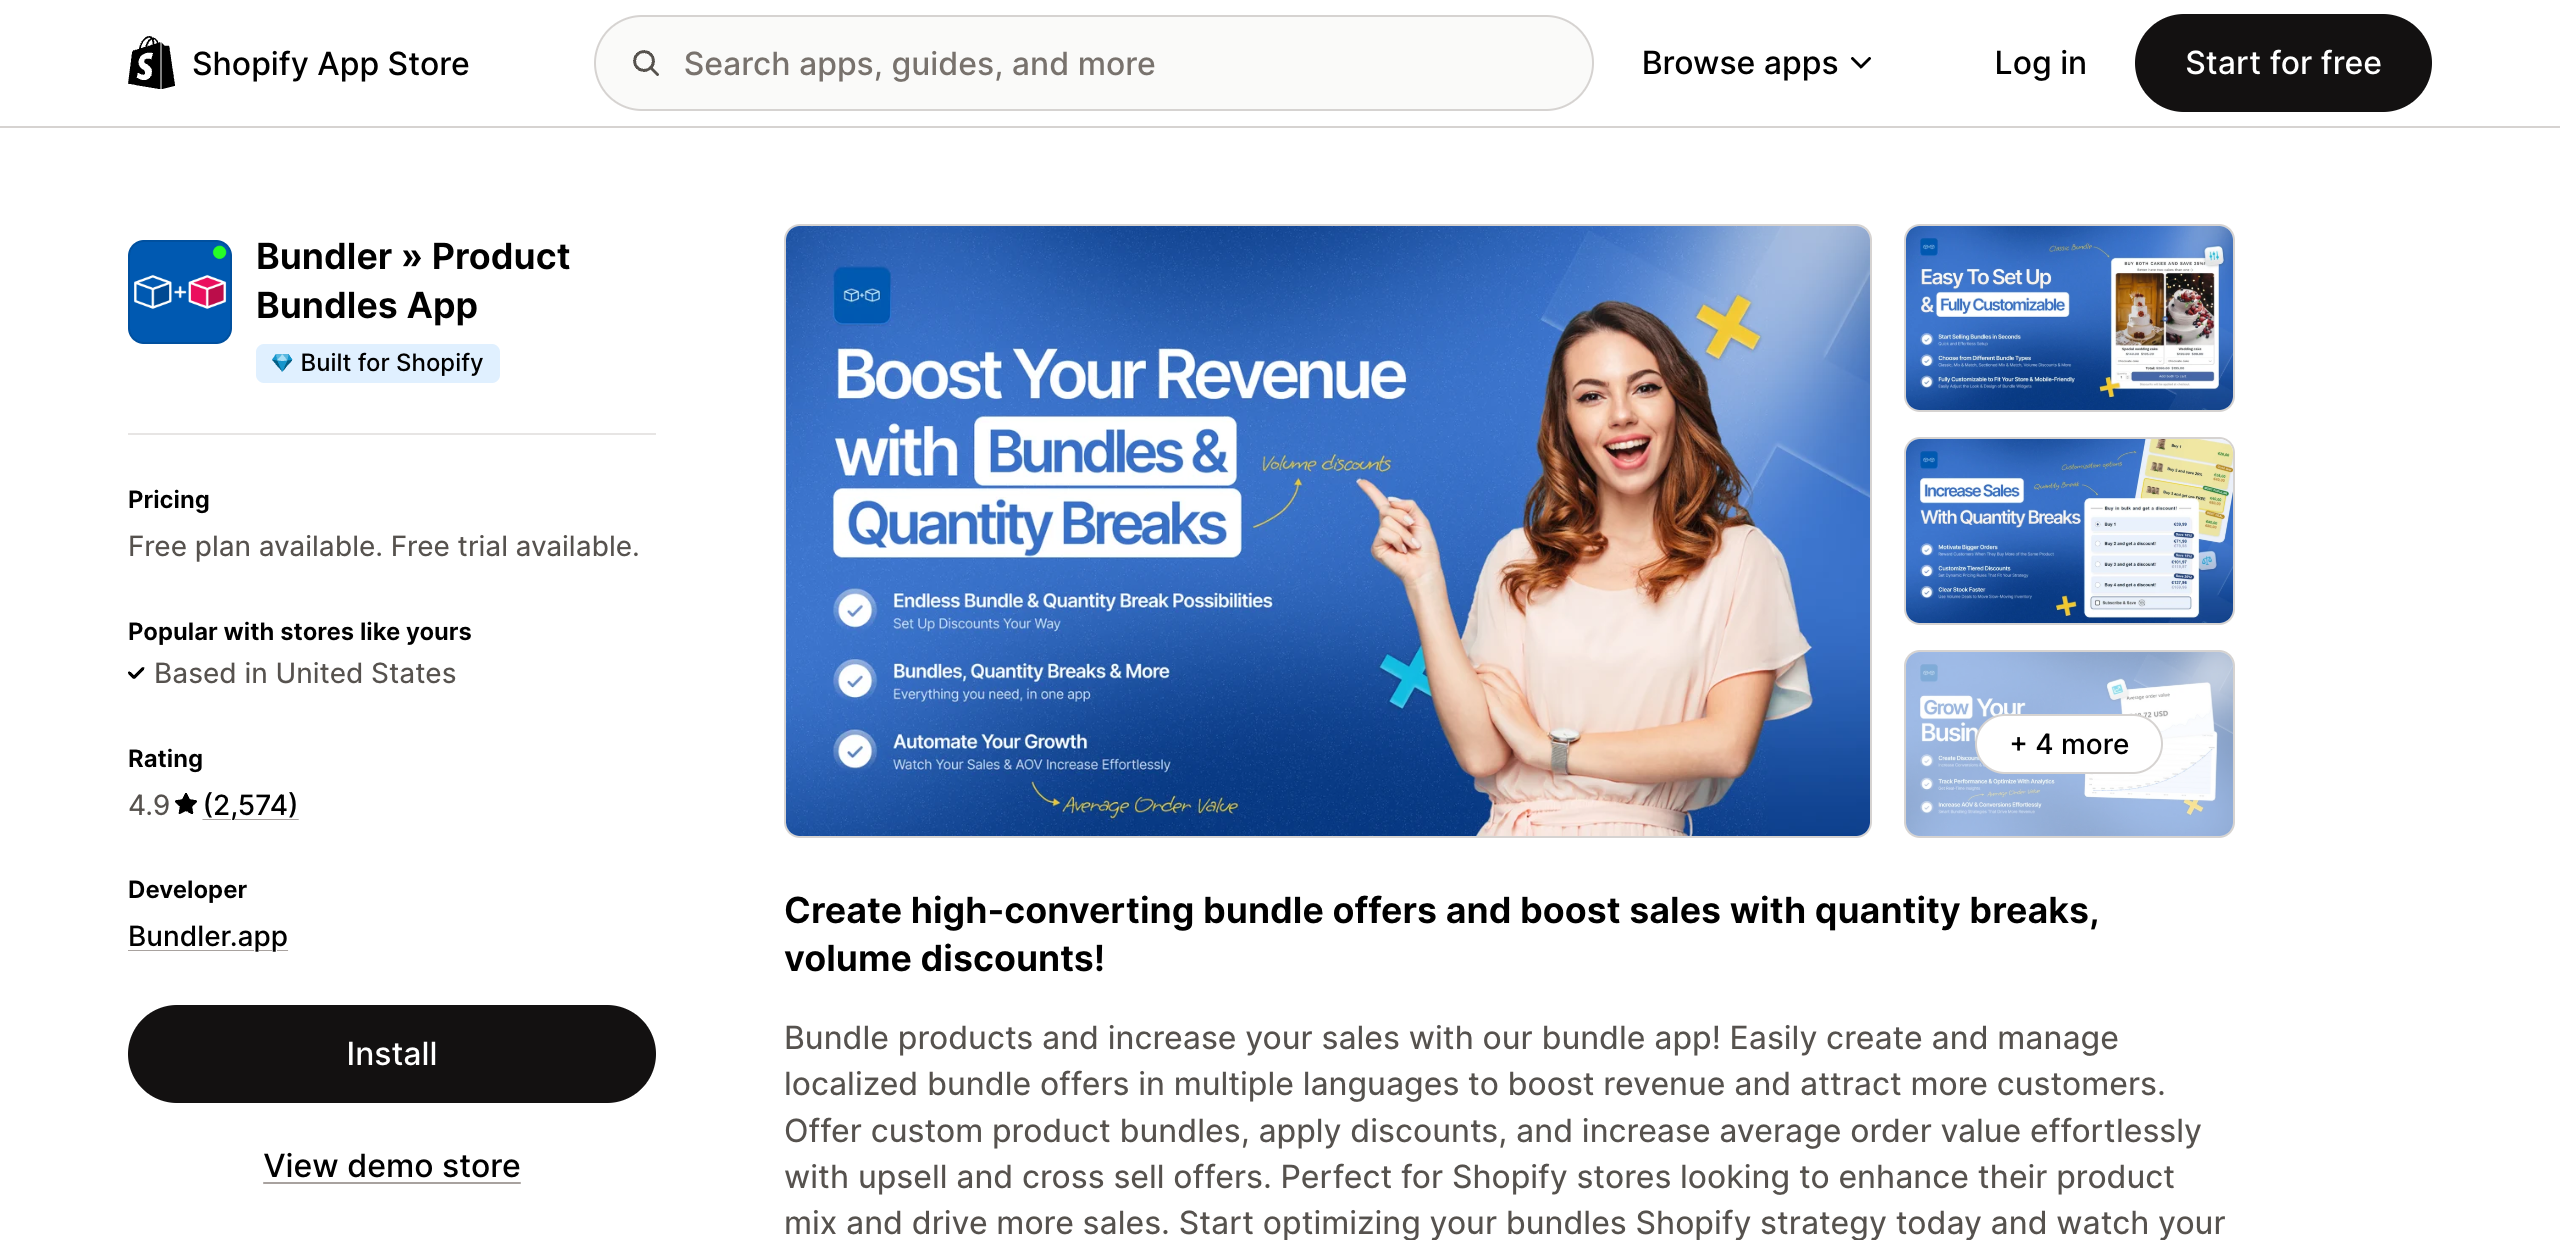
Kaching Bundles
Rated 5.0 stars from more than 5,400 reviews, free to install with paid plans from around $14.99 a month and a 7 day trial. Kaching Bundles is built for volume breaks specifically: buy two get a discount, buy three get more, displayed as a tiered block on the product page. If your products are consumable or repeatable, this is the lever three tool that requires the least merchandising thought, because you are not inventing bundles, only pricing quantities.
Simple Bundles and Kits, by Freshly Commerce
Rated 4.9 stars from 757 reviews, with a free plan covering 3 bundles and 50 orders a month, and paid plans from around $14 a month. Simple Bundles and Kits is the one to reach for when bundling has to survive contact with real fulfillment, because it breaks bundles into their component SKUs for inventory and for your 3PL or warehouse system. If Shopify Bundles fails you on mix and match or on inventory behavior, this is the usual next step.
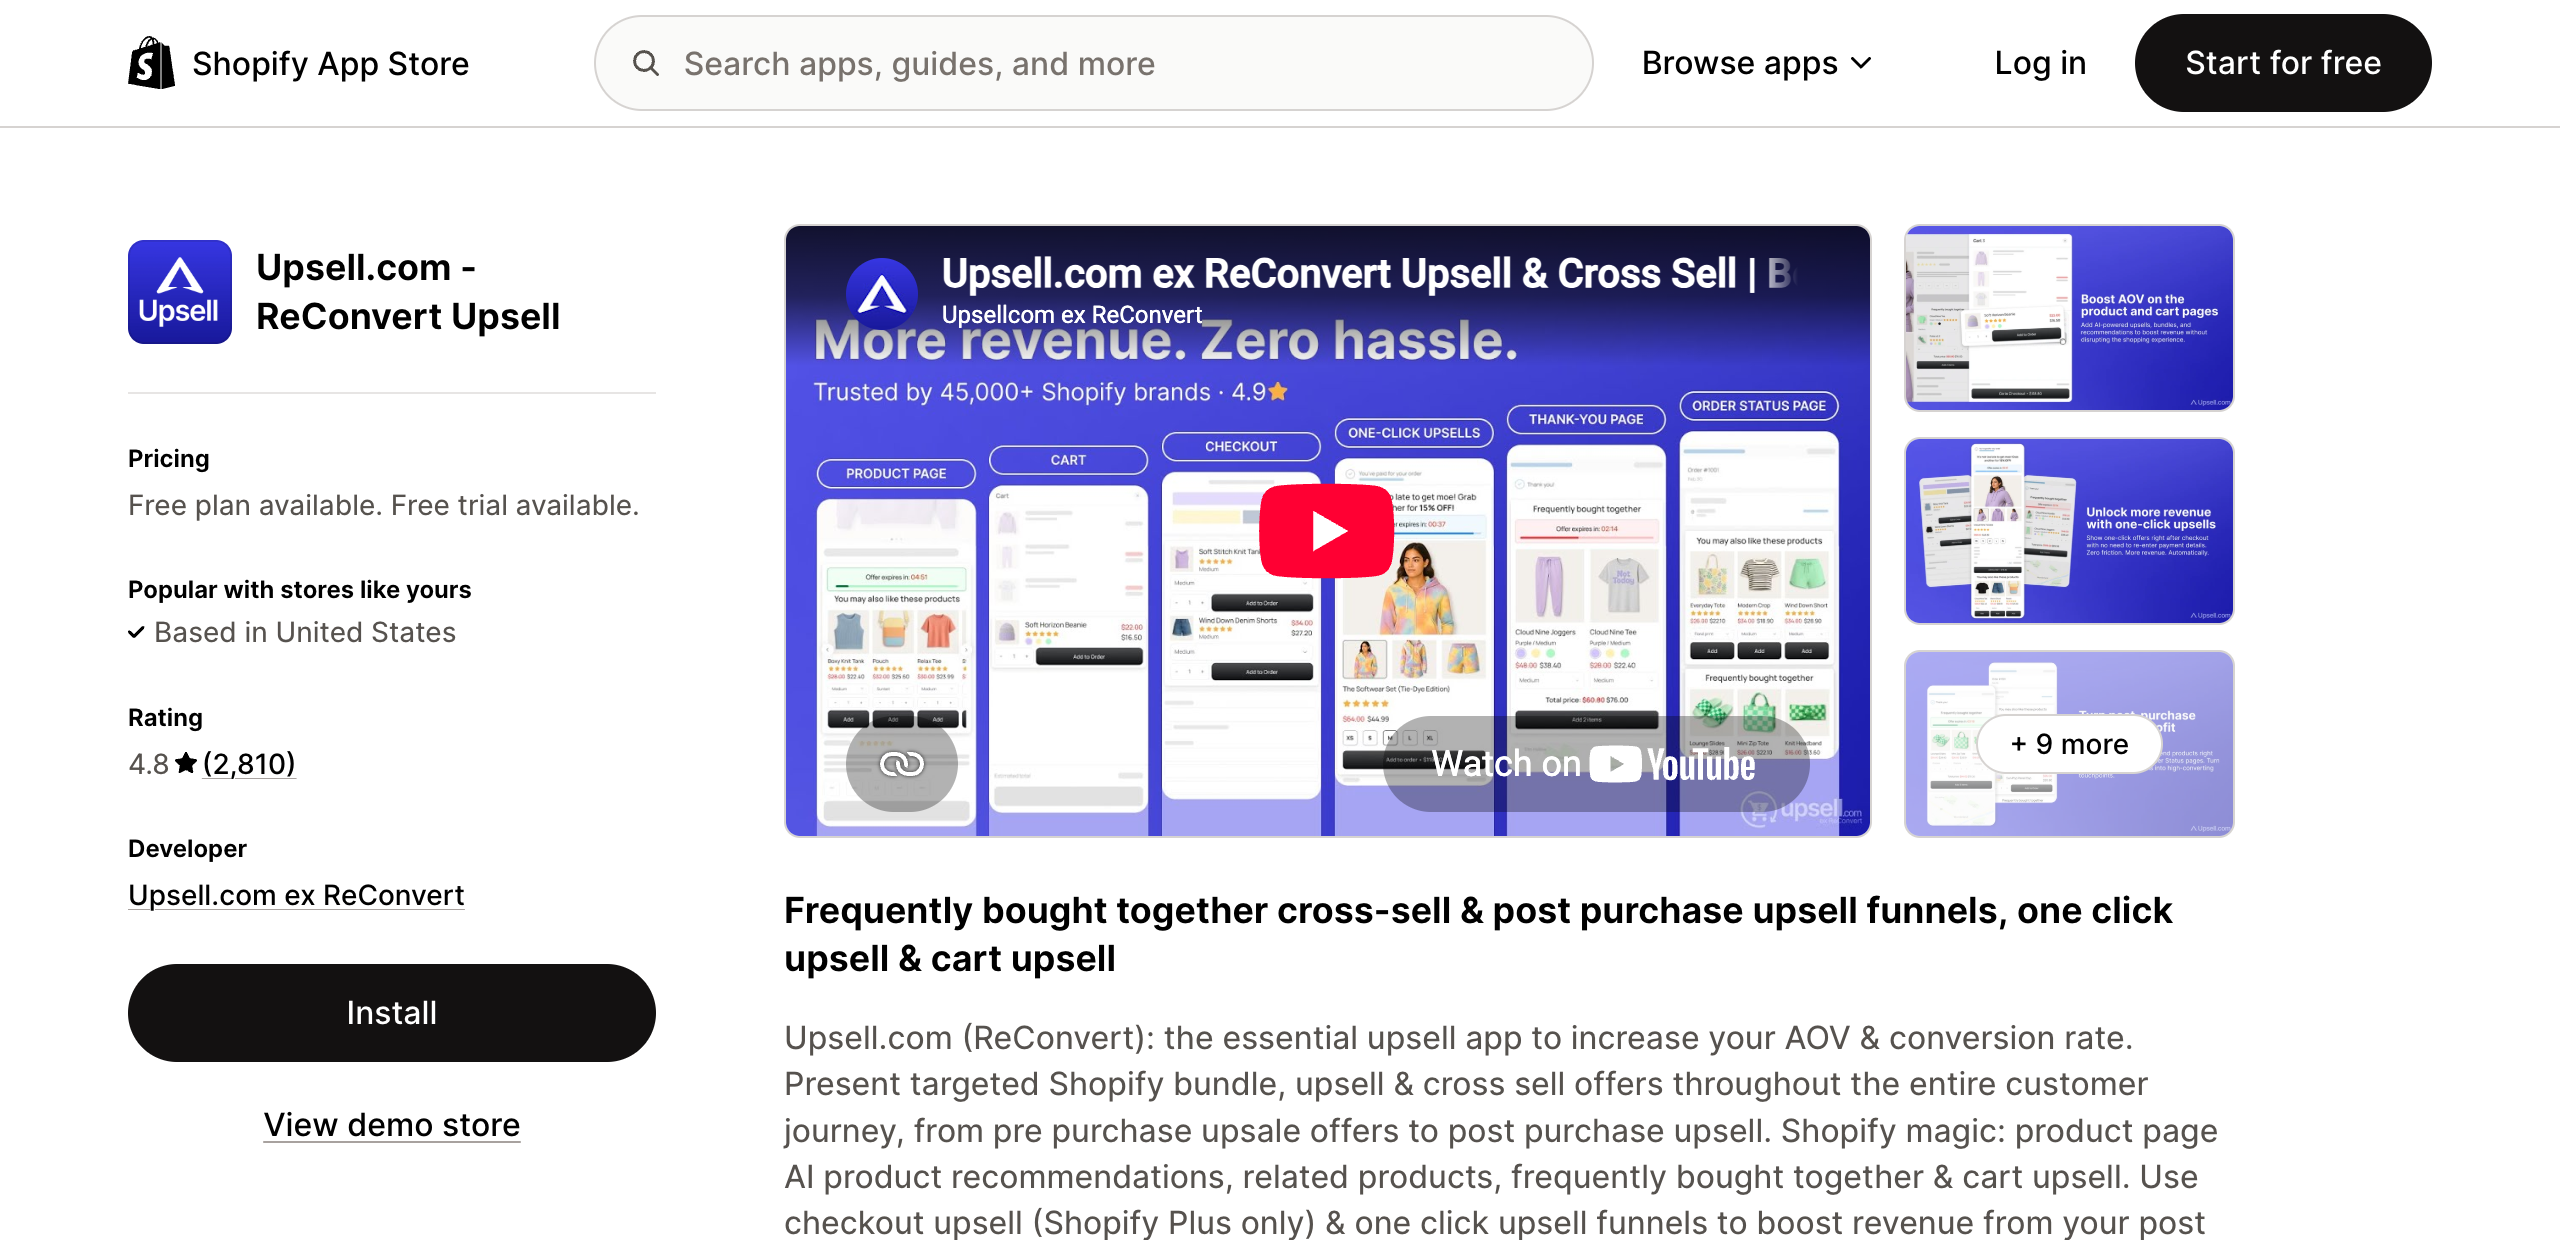
Upsell.com, formerly ReConvert
Rated 4.8 stars from 2,809 reviews, with paid plans starting around $4.99 a month and a 14 day trial. Upsell.com is the best known thank you page and post purchase tool, and it also builds the checkout and post purchase funnels that lever four depends on. Worth remembering the caveat from lever four: this raises real revenue per customer more reliably than it raises the reported paid order value.
What We Are Not Telling You
Every list of apps on the internet is somebody's affiliate income. Here is ours, in full.
We have no affiliate relationship with any app listed above. No referral links, no revenue share, no sponsorship, no commercial arrangement of any kind with any of the eight developers. The links go straight to the public App Store listing with nothing appended to them. Nobody paid to be on this page and nobody paid to be left off it.
The apps were picked off public App Store ratings and review counts as checked on September 1, 2026. Those numbers change, sometimes quickly, and a five star app can be acquired and rebuilt into something else within a quarter. Treat every figure above as a snapshot with a date on it rather than a fact.
We recommended Shopify Bundles first even though it carries the lowest rating on the page by a wide margin. That is not a mistake and it is not contrarianism. It is free and it is first party, and because no app on this list pays us anything, we have no reason to steer you toward a monthly bill before you know whether you need one.
And the part that matters most. A higher average order value makes your store easier for us to fund. Look at the sum at the top of this post: it is our sum, not a general purpose ecommerce truth we happened to find lying around. We pay for the clicks and we bill a commission on the orders, so your average order value sits directly inside our own economics. We are not neutral about it. That is precisely why this post exists, and we would rather say so in the middle of the page than bury it in a footer.
None of that makes the arithmetic wrong. It does mean you should check it, which is why every number in it is shown rather than asserted.
Three Ways This Goes Wrong
Discounting your way to a bigger basket
This is the common one, and it is the reason average order value is a bad metric to chase on its own. A discount that pushes people over a threshold raises the recorded order value and lowers the money you keep.
Concretely. Say you run a 40% gross margin and your average order is $55, so you keep $22 of gross profit. You introduce a $75 free shipping threshold and a 15% off code to help people reach it. A shopper takes $75 of goods, pays $63.75, and those goods cost you $45. Your gross profit is now $18.75.
Recorded average order value went up 16%. Gross profit went down about 15%. You are also now paying the shipping. And because commission is charged on order value, our cut went from $6.60 to $7.65 while your net went from $15.40 to $11.10. The metric improved for both of us and the business got worse for one of us.
The fix is to check margin before the threshold goes live rather than after. Our profit calculator will do the arithmetic on what a given discount actually costs you. A cart threshold that is funded by attachment rather than by discount raises order value and margin together. One funded by a coupon usually raises neither of the things you care about.
Bundle SKUs quietly breaking your Merchant Center feed
This one is invisible until traffic drops. A bundle you create is a new product in Shopify, so it flows into your Google Shopping feed like any other product. It is not like any other product, because it has no manufacturer barcode.
Two things go wrong. If the bundle inherits a component product's GTIN, Google now sees the same GTIN attached to two products at two different prices, which produces invalid GTIN errors, price mismatch warnings, or a quiet loss of the rich product matching that makes Shopping work at all. If the bundle has no GTIN and you have not said so, you get missing identifier errors instead.
The correct handling is to give the bundle no GTIN at all and set identifier_exists to false, or to use the is_bundle attribute where your feed setup supports it. Audit Merchant Center in the week after you launch bundles rather than assuming silence means success. Our complete guide to Google Shopping ads on Shopify covers the feed attributes and how Shopify maps them.
Measuring blended average order value instead of paid
The average order value on your Shopify analytics dashboard is blended. It contains your email list, your returning customers, your direct traffic, anyone who came in through a wholesale or trade account, and every organic visitor who already knew your brand. Those buyers spend more than a stranger arriving from a Shopping grid, usually noticeably more.
The number in the sum at the top of this post is the paid Shopping one. Using the blended figure instead means feeding the model a number that is optimistically wrong, and the correction arrives later as a campaign that does not perform the way the arithmetic said it should.
Find the real one by dividing conversion value by conversions for the Shopping campaign in Google Ads, or by segmenting order value by session source in GA4. Then run both numbers through the calculator and see how far apart they are. If they are close, you have an unusually consistent store. If the paid figure is 20% or 30% lower, that gap was going to show up in the results either way, and it is better to find it in a spreadsheet.
What to Do in the First Two Weeks
Days one and two: get your paid Shopping average order value, not your blended one, and write it down. This is your baseline and you cannot claim any improvement later without it.
Days three and four: set a free shipping threshold 15% to 30% above that number. Check first that your margin at the threshold covers the shipping cost. If it does not, raise the threshold rather than absorbing the difference.
Days five to seven: put a cart drawer with a visible progress indicator in front of shoppers, plus exactly one cross sell slot on the product page. One slot. Not a carousel.
Week two: build three to five bundles or quantity breaks from actual co purchase data in your order history rather than from intuition. Then check Merchant Center for feed errors before you do anything else.
End of week two: stop, and leave it alone for two more weeks. The most common mistake here is launching all four levers on the same day, which guarantees you learn nothing about which one worked. Order value data is noisy at low volume, and a fortnight of clean data beats a month of confused data.
The Honest Ceiling
Everything above has a limit, and pretending otherwise would undo the point of the disclosure.
Average order value is not infinitely elastic. It is anchored to what you sell. A store selling one $28 item to people who want exactly one of that item is not becoming a $140 store because it installed a cart drawer. The realistic range for a store that does this work properly is somewhere between 5% and 15%, occasionally reaching 25% for a store that previously had no cross sell, no bundles, and no threshold at all. Above that, you are usually looking at a change in what the store sells rather than how it sells it.
In a multiplicative sum, 10% is a real contribution. Ten percent on order value is the same as ten percent on conversion rate and the same as ten percent on commission rate, and stacking three of those is how a marginal store becomes a viable one. But 10% does not rescue a store that is 5 times short on its own, which is why the honest version of this advice includes the possibility that the answer stays no.
There is a related point worth reading if the numbers came out badly. Performance across the stores we fund follows a power law rather than a normal distribution, which we wrote about in why PPC behaves like a power law. Most stores sit in the long tail and run perfectly good businesses there. And if your order value is fine but your catalog is not earning its keep in the auction, the problem may be a different one entirely, which is what escaping low revenue mode is about.
The useful thing about a sum with three terms in it is that it turns a vague worry into a line you can stand on one side of. Put your own numbers into the feasibility calculator, find out how far off you are, and then decide whether the distance is worth closing. Sometimes it is a fortnight of merchandising work. Sometimes it is a channel that was never going to be yours, which is a fine thing to know early and for free.
One caveat on everything above. The click cost, conversion haircut, and target return used in this post are our own measured figures as of September 2026, across our own portfolio, and they are averages over a wide spread of stores. They are published so the arithmetic can be checked, not so it can be treated as a forecast for any individual store. This is educational rather than financial advice. Use your own numbers, verify everything against your own reporting, and treat any figure here that you cannot reproduce as a question rather than a conclusion.